Graphic presentation of costs and times
In this section, you will learn how to analyze costs and times shown in doughnut charts.
Requirements
Analyzing costs
After the calculation of a part, costing24 displays each Setup costs and Unit costs in a doughnut chart.
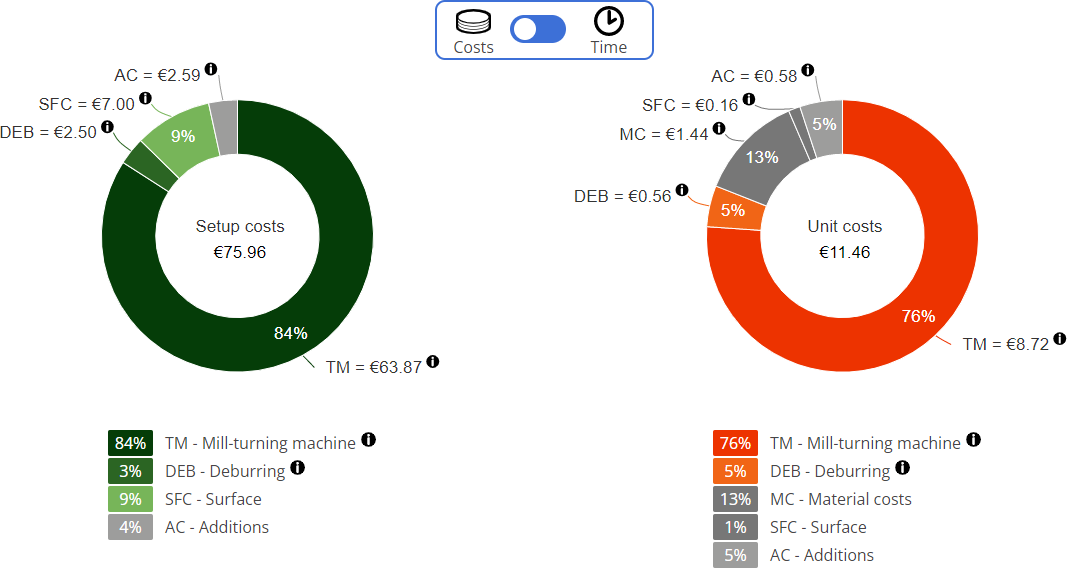
Detailed information on Setup costs is displayed in a doughnut chart, an additional doughnut chart displays detailed information on Unit costs.
In the Setup costs chart, the total costs to set up the machine are shown. Furthermore, the shares of the setup costs are shown in percentage pertaining to the machines used in the manufacturing of the part. In the chart, the shorthand terms and the name of the machine are displayed.
In the Unit costs chart, the total unit costs for the manufacturing of the part based on the lot size specified in the Lot size field. Furthermore, the distribution of the unit costs' percentage pertaining to the production of the part is shown. In the chart, the shorthand term and name of the machines and the shorthand terms and names of the costs are shown.
Analyzing times
After the calculation of a part, costing24 displays each Setup time and Time per unit in a doughnut chart if you click on the ![]() button.
button.
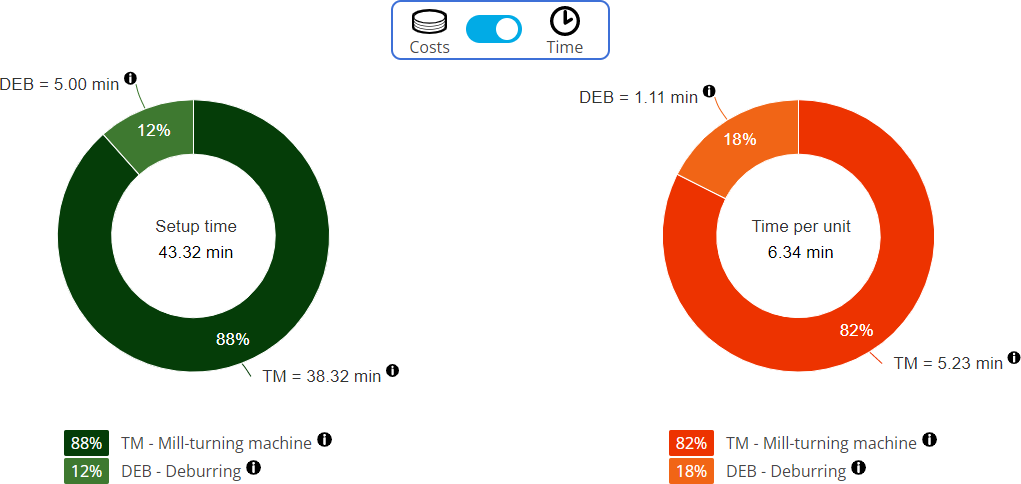
Detailed information on Setup time is displayed in a doughnut chart, an additional doughnut chart displays information on Time per unit.
In the Setup time chart, the total time to set up the machine is shown. Furthermore, the shares of the setup times are shown in percentage pertaining to the machines used in the manufacturing of the part. In the chart, the shorthand term and names of the machines are shown.
In the Time per unit chart, the total unit costs for the manufacturing of the part are shown. Furthermore, the distribution of the unit costs' percentage pertaining to the production of the part is shown. In the chart, the shorthand term and names of the machines are shown.